Detecting Javascript Memory Leaks
Every app I’ve built in the past has pretty much been unaware of memory management. Computers these days are packed with memory, and even if you load a ton of AJAX requests, chances are the user will be refreshing or going to a new page before their memory runs out. Recently, however, I’ve been working on a display piece for Cultivate Studios, and there is a ton of data that moves in and out. For this specific project, the high end is around 100 updates per minute, each of them requiring a DOM insert, smooth transitions to shuffle existing elements and display the new one, and smooth removal of stale items. On top of all that, the page could be open - literally - for weeks. For the first time, I’ve had to really worry about memory management in javascript.
The down side is that there aren’t really any great tools for monitoring javascript memory usage over long periods. Yes, chrome has some awesome features for watching memory usage, but they’re really targeted for short timeframes. The best option was to record usage on the dev tools Timeline, and watch the memory graph. Unfortunately, that seems to gather an unnecessarily large amount of data, and running it for a long period of time is certain to crash your browser.
Lucky for me (and you?), chrome has recently opened up a new experimental API to view process information. I’ve built a chrome extension that watches for memory updates, and sends the update to your app. Chrome seems to update about once every second - this is a lot of data, but I ran it for about 5 hours today and my browser didn’t become the least big sluggish.
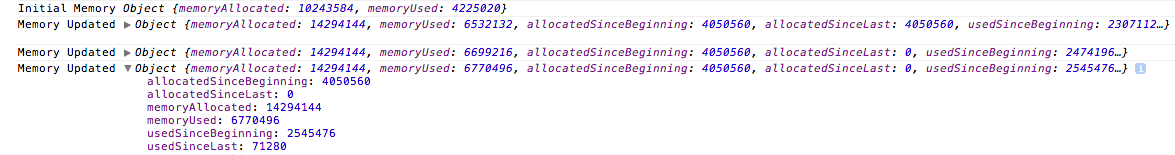
You can see in the above that there are two metrics that I’m able to watch - memory allocated, and memory used. The extension is built to save (and output) the amount of memory that your app is using at the initial load time. It then provides regular updates on the updated allocation and usage values, as well as how those numbers compare to the initial metrics and the metrics from the previous update. I’m using a 13” MacBook Pro, and all of those metrics print out on a single line in my chrome console - this makes for a very easy spreadsheet-like view.
Feel free to check out the extension for yourself. Just as a note, you will have to enable the experimental APIs in your chrome://flags.
Oh, and another note, the current version will start spitting out memory usage metrics for every open tab as soon as you install it. Obviously, it’s probably not a good idea to leave this extension enabled during normal browsing - things could get a bit chaotic.