Understanding Data Pipelines by Example
Data is a pretty hot thing. Some people even say data is eating the world. Unfortunately, “Big Data” sounds really intimidating - I’ve been an engineer at a data company for years, and all this time I’ve been too intimidated to actually learn how modern data pipelines work.
Today that stops! I’ve taken a list (stolen from a Stitch blog post) of big companies managing big data pipelines, and tried to understand all of the tools they are using. I’ve summarized everything here - hopefully this serves as a (really long) resource for all of us to get over our fears of “Big Data”.
Buffer
Ingestion & Transformation
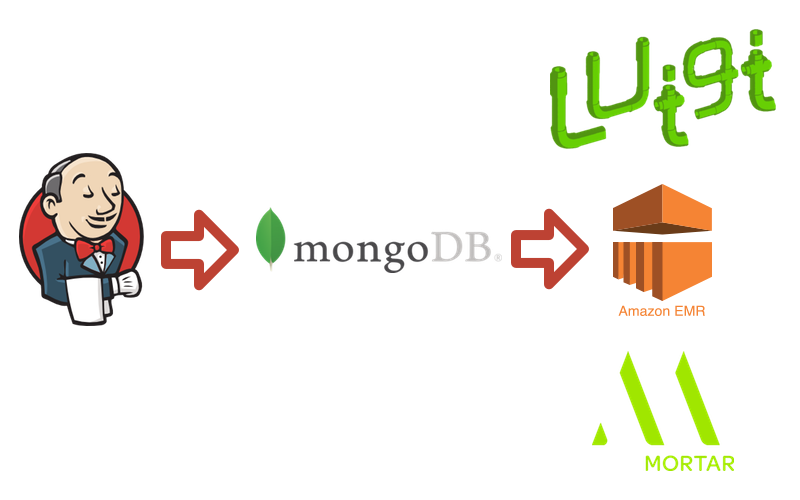
A Thing To Learn: Jenkins
Jenkins is our first technology to talk about here, and it’s conveniently one that I have worked with before. Unfortunately, Buffer is the only company that lists using Jenkins in their data pipeline. Perhaps that makes them innovative!
Jenkins was designed to be a tool for continuous integration & delivery. If you’re not an engineer that means it is a handy tool that helps programmers automatically check that their code is working, and automatically send out updates with new code. That said, at its core, Jenkins is actually just a really good automation server. It can do pretty much anything that you tell it to do, automatically. For Buffer, they use Jenkins’ scheduling capabilities to automatically kick off their ETL (Extract, Transform, Load) processes.
A Thing To Learn: MongoDB
MongoDB is yet another technology that I’m quite familiar with. MongoDB is a database - similar to MySQL or Postgres, if you’re familiar. However, Mongo differs in one very important way: it is a document database, as opposed to a traditional database. A document database stores semi-structured data. Document databases are often used when you’re storing data with loose schemas, or with a lot of nesting. They can have powerful data models, but aren’t as good with relational queries as a standard relational database would be.
A Thing To Learn: EMR
EMR stands for Elastic Map Reduce. “Elastic” is a fancy way for nerds to say that something can be run in very simple or very complex ways - the technology is flexible to stretch to your needs. So EMR is like “Flexible Map Reduce”. It is a service that Amazon provides that allows you to run traditional MapReduce jobs on top of their scalable EC2 infrastructure.
But… what’s MapReduce you ask?! It is a conceptual framework used by many data computation tools, and it’s generally most useful across massive datasets. MapReduce suggests you break your computation up into two stages: Mapping and Reducing. Mapping is sort of what it sounds like - the system will generate a map of the data that is important for the computation, and where it all exists.
Once you have a map, you can begin “reducing” it. Reducing is a sort of summary step - you take all of the data on your map and combine it in some way. Reducing might just mean counting the data, or summing it, or any other sort of computation you can imagine.
A Thing To Learn: Mortar
This is a tricky one. Mortar Data was a tool used by Buffer. I’m sure it was amazing, as their company has since been acquired by the also amazing DataDog. I can’t tell you much about what Mortar actually did, aside from what Buffer says.
a platform-as-a-service company that helps you get up and running with big data technologies really quickly.
Storage, Analysis, & Visualization

A Thing To Learn: Redshift
Amazon Redshift is all the rage right now. I believe that all but one of our example companies use Redshift.
Redshift is a data warehousing solution. It’s highly scalable - from petabytes of data even to exabytes of data - and pretty simple to use. Redshift has a few different storage technologies it can use, but most of the time it uses a columnar store. That means that if you have large or complex schemas for your tables, Redshift can avoid reading the entire row when performing a query - it will only read the columns that are necessary for the computation
Redshift provides an interface that feels much like working with a regular SQL database. Redshift has tables with strictly defined typed columns, and a standard SQL query interface.
A Thing To Learn: Looker
Looker is an analysis tool that lets most anyone across the company get their hands dirty in the data, and produce some pretty powerful data visualizations from it. Looker will run on data stored in an external store (Redshift, in Buffer’s case). It makes some pretty intelligent assumptions about the data model in the store it is given, but gives additional power for defining business logic that will appear as queryable data to end users. This means that a data team can tell Looker how to compute KPIs like Monthly Recurring Revenue, and that will appear as an available field when your marketing runs Looker reports.
Spotify
Ingestion & Transformation
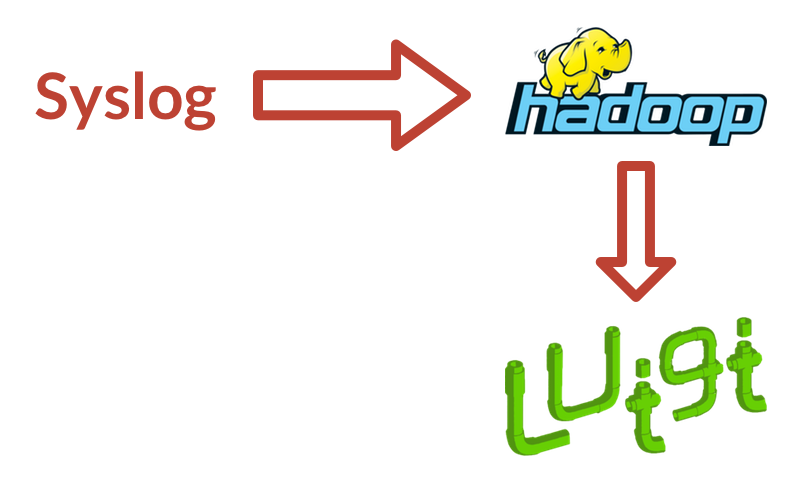
A Thing To Learn: Syslog
Syslog is a bit of a confusing thing to be mentioned on a list of data tools - it’s incredibly generic. Syslog, simply put, is a standard for logging things. It’s a pretty handy format that programmers have adopted for talking about what’s happening in their applications. Any application - from your Grandma’s Wordpress site to cool NASA robots - is likely to use a syslog format for its logs. Spotify has written some custom tools to parse the syslog format and pluck out messages that should be propagated to their data warehouse.
A Thing To Learn: Hadoop/HDFS
Spotify mentions that they use something called HDFS. Before we can really talk about HDFS, I need to explain Hadoop.
Hadoop is the first implementation we’ve run in to of the MapReduce model I explained above! Hadoop takes an approach of making MapReduce function on a cluster (group of many computers) that are all built on commodity hardware. Hardware failure is a core tenant of Hadoop, so it is highly resilient against data loss.
A core technology to how Hadoop does this is HDFS - Hadoop Distributed File System. The idea behind the HDFS is to take large data files (typically multiple gigabytes) and break them up across many distributed hosts. The data will be spread in such a way to avoid loss due to hardware failures, and to also optimize reading of data when a MapReduce job is kicked off.
A Thing To Learn: Luigi
Spotify just glosses over their use of Luigi, but we will hear a lot about Luigi in the next few examples. It is a core piece of technology for many data pipeline architectures.
In fact, Luigi was built to be a tool for orchestrating entire data pipelines. It is a strong tool for orchestrating complex pipelines where jobs have many dependencies that need to happen in a specific order, and may be long-running. Luigi is sort of like the plumbing of a data pipeline - you have all of your other tools that do actual work on your data, and Luigi is the infrastructure that moves that data around to the right places at the right times.
Analysis, Storage, & Visualization

A Thing To Learn: Hive
You’re probably guessing it based on the cute logos above, but Hive is very closely related to Hadoop. In fact, Hive is built on top of Hadoop.
As it turns out, MapReduce jobs are pretty hard to write for the average data analyst. You need some pretty gnarly Java chops to get any analysis done in straight Hadoop, and that just doesn’t fly with most analysts. Hive provides a SQL-like query interface on top of Hadoop, called HiveQL. The syntax is near-identical to SQL, which many analysts are familiar with. The difference, however, is that HiveQL eventually is compiled down to Java code that will run a regular MapReduce job on Hadoop.
Looker
Ingestion & Transformation
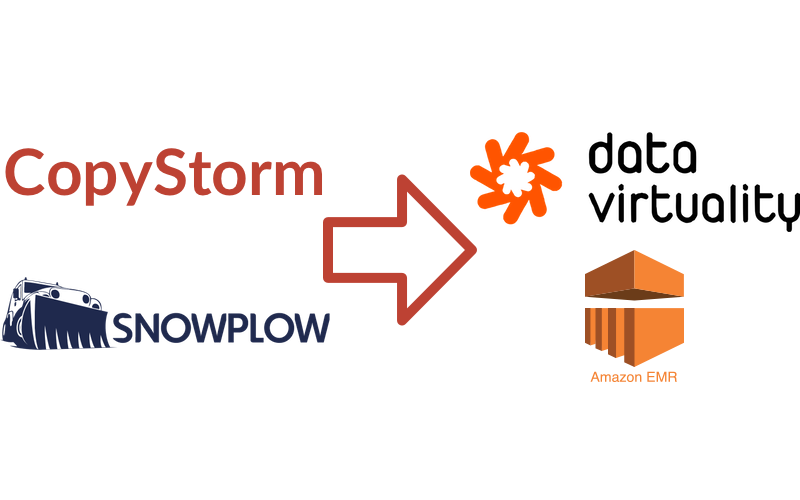
Looker is a fun example - they use a standard ETL tool called CopyStorm for some of their data, but they also rely a lot on native connectors in a lot of their vendor’s products. For instance, they reference Marketo and Zendesk will dump data into their Salesforce account. They also have scripts that will pull data from Github and Discourse’s APIs to dump into their Postgres. Salesforce and Postgres become their initial ingestion sites that get piped into the actual warehouse.
As an additional note, EMR is mentioned as a technology in this pipeline. This is the same EMR we mentioned before, but in this case it is an internal process of Snowplow (which I will explain later). If you’d like the specifics on how Snowplow uses EMR, check out their EmrEtlRunner.
A Thing To Learn: CopyStorm
CopyStorm was not actually intended to be a tool for data warehousing - it is more specifically a Salesforce backup tool. It evolved a bit, though to have a secondary function of exporting incremental Salesforce data to your own database. In the case of Looker, that database is Redshift.
A Thing To Learn: Snowplow
Snowplow has two branches of their product: Snowplow Insights and Snowplow React. Looker uses the Insights product, so I’ll describe that in more detail. In short, Snowplow React creates an analysis interface for your data that will allow your application to make real-time decisions based on data.
Snowplow Insights, however, is a data collection tool. It’s incredibly powerful, in that the Snowplow team has looked at all of the different verticals in which you might want to collect data - social, mobile, web apps, contact forms, server performance, IoT, etc. - and has built opinionated data collection tools for each of them. You can simply turn on Snowplow in each of your environments, and it will begin collecting well structured data with very little setup time. Snowplow then integrates with many different storage environments to send the data directly into your warehouse.
Storage, Analysis, & Visualization

Looker is actually pretty simple on the analysis side. This should probably be expected, given that their product is a data analysis tool. They want to dogfood as much as possible.
All of Looker’s data ends up in Redshift after their various Ingestion+Transformation steps. Once there, they connect it in to their own product (Looker) to build reports and insights for their team.
Ingestion & Transformation
Pinterest is a huge data company, which has forced them to build a few custom tools to support their heavy usage of existing open-source data tools. Luckily, they talk a lot about the tools they’ve built, so we can get a good idea of how their pipeline works.
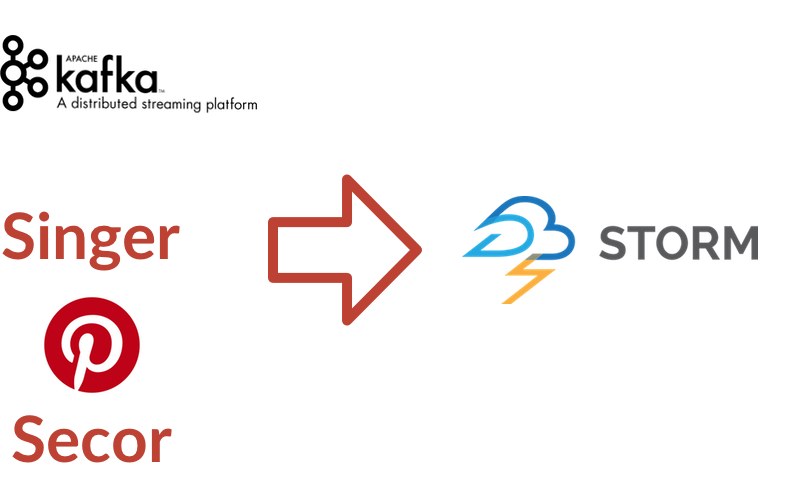
A Thing To Learn: Singer
Singer is an internal tool built by Pinterest. It is unfortunately not open source, so we can’t use it… but we can understand it! Singer is a log parsing and delivery tool. Pinterest runs Singer on all of their app servers. Whenever a new log file becomes available Singer will pick it up, parse it, and ships that data off to a central repository.
A Thing To Learn: Kafka
Kafka is a distributed streaming platform, and is built around the idea of being the central mechanism for data pipelines. The core value of Kafka is a pub/sub model of message passing - it can receive data from many producers, and stream that data to many consumers. At the end of all of your processing, Kafka can tie in to your data warehouse to store the fully processed data.
Pinterest uses Kafka as a middleman for their log parsing process. Logs are published to Kafka (after being read by Singer), and are then published to various subscribers to process and deliver that data elsewhere.
A Thing To Learn: Secor
Secor is yet another internally-built Pinterest tool, but this time it’s open source! Secor has a pretty simple mission: take log files from Kafka and store them somewhere that doesn’t struggle as much with eventual consistency. This destination happens to be Amazon S3.
A Thing To Learn: Storm
Storm is a big ol’ realtime data processing engine. It is conceptually broken down into many smaller parts, but the most important pieces are Spouts and Bolts. You can kind of think of spouts and bolts as being similar to Map and Reduce - the big difference here is that Storm runs its process indefinitely, as opposed to a MapReduce that has a definitive beginning and end.
Spouts are the ingestion half of Storm - they connect to a stream of data and manage that data until it is fully processed by the bolts. In Pinterest’s case, they have a Storm Spout that connects to and reads from Kafka.
Bolts do the actual processing of the data. This is mostly like a “Reduce” step in MapReduce, but there is some mapping work as well - bolts can do filtering and sorting.
Storage, Analysis, & Visualization
A Thing To Learn: S3
Amazon S3 is essentially a big cloud-based file storage system. It’s hard to believe that it took this long to get to S3, because I think almost every cloud-based SaaS company uses S3 for something.
You can kind of think of S3 like a very programmer-friendly Dropbox. You upload files to it, and then you can read those files. The nice thing about S3 is that it integrates really well with the rest of the AWS suite - EC2 instances can mount S3 as a drive, EMR can read directly from S3, Athena can use S3 as a data source, Redshift can easily import from S3. It’s a great place to store files if you use AWS, and is very often used as a data lake.
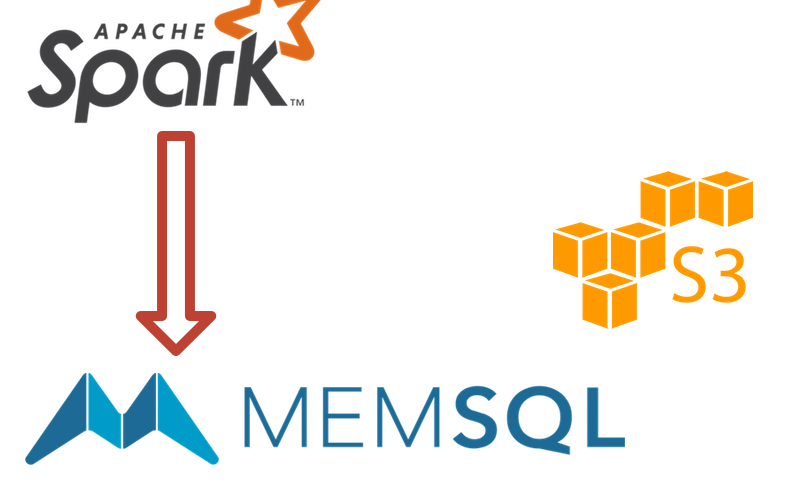
A Thing To Learn: Spark
Spark is a data processing engine. It’s built for general purpose processing, but finds a lot of its usage in the data pipeline world. It has a ton of built-in operations that can be used in processing jobs, many of which mirror what is done in more traditional MapReduce systems like Hadoop. Spark prides itself on being a lighting fast.
For Pinterest, Spark is used as a sort of parallel process to Secor. It does the same general computations as Secor, but it does them in real-time so that the data can be passed to MemSQL.
A Thing To Learn: MemSQL
Once the data is processed in Spark, it is passed to MemSQL. MemSQL is an in-memory database built for extremely fast analysis. MemSQL was built with the intention of being used for real-time data, and that is exactly how Pinterest uses it. Because all of your data lives in memory, ingestion is extremely fast, and the data is immediately available for analysis. Analysis is also very fast, because nothing has to be read from the disk.
The downside to MemSQL is that the storage is not safe at all. Hardware failures will be catastrophic for your data - if a computer fails, any data that is stored on it is lost. MemSQL is not meant to be a persistent storage layer - Pinterest, along with most MemSQL users, store their data in MemSQL in addition to a persistent storage layer like S3 or Redshift.
Metamarkets
Metamarkets has one of the more interesting data scenarios, because they have a hard reliance on real-time data. So far we have seen a lot of data stores that rely on batch processing by things like EMR, that eventually end up with consistent data in Redshift. Those pipelines are great, but they rely on scheduled tasks running daily, weekly, or on some other interval to move the data into the warehouse. This is specifically not real-time, and wouldn’t have worked for Metamarkets.
I will be skipping the Storage & Analysis section for Metamarkets, because they use Druid for their database and querying engine. I’ll be covering Druid in this ingestion section, because it is intimately related to the rest of their ingestion pipeline.
Ingestion & Transformation
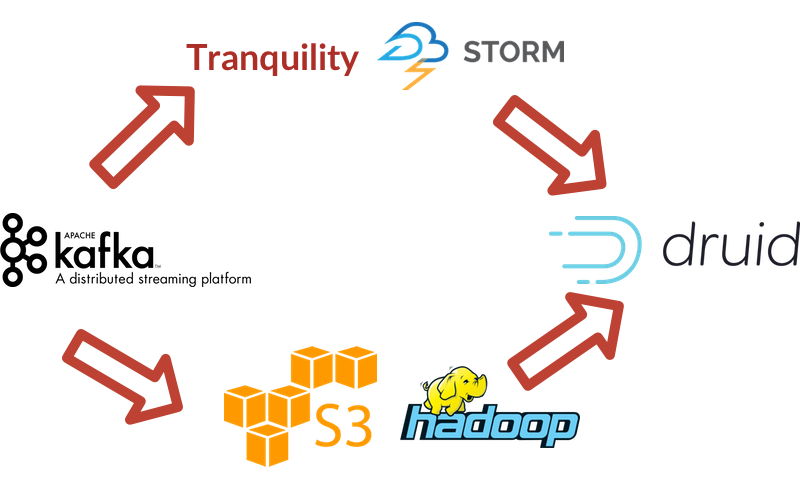
Looking at the image above, you’ll notice that is significantly different than any of the other pipelines I have mentioned. This is called a lambda architecture, and it is a necessary architecture to support real-time data. The concept here is that you have two data pipelines that run in parallel - one that processes data immediately as it comes in, and another that processes that data again in batch. Real-time data feeds are necessarily lossy and inconsistent, so you must follow them up with a stricter batch processing route to have fully consistent historical data.
A Thing To Learn: Tranquility
Tranquility is an open source stream processing tool built by Metamarkets. It is intimately tied to Druid, which is the only output destination Tranquility supports. Tranquility is sort of just a bunch of other technology rolled up together to make nice Druid streams, the most notable of these being Storm. Tranquility takes the entire real-time data processing system and handles it all - partitioning, replication, service discovery, and schema rollover - in one package.
A Thing To Learn: Druid
Druid is yet another database! Druid is similar to Redshift in that it stores data in columns as opposed to rows, but it serves a very different mission. Druid is optimized for running aggregated analysis - so things like summing values across many records, or counting records, or calculating percentiles across a segment of data. Druid is extremely fast at this sort of analysis, but it is not very good at picking out fields from specific records. It does not perform like a regular SQL database in that regard.
SeatGeek
This is our first example where there are no new technologies to learn! That must mean we’re starting to understand #BigData!
Ingestion & Transformation

For almost their entire data pipeline, SeatGeek relies on Luigi. They don’t talk about sources very much, but wherever the data is coming from they pick it up in Luigi, process it there, and then drop it off in S3 to be loaded into their warehouse. It’s not clear if they use S3 as a persistent data lake, but I’d imagine that they do. SeatGeek’s team is very SQL-heavy, so they have appreciated Luigi’s ability to quickly and modularly add transformations to their data so it is easier to query like SQL data.
SeatGeek also has a MySQL database that they use to serve their production app. This data bypasses S3 and is loaded directly in to Redshift, where it is then further transformed (presumably by Luigi). This separate process is used to decrease the amount of time that their ETL process strains their production database.
Storage, Analysis, & Visualization

After all of that transformation, the data is moved over to Redshift (and sometimes transformed further inside of Redshift).
As I mentioned before, SeatGeek’s team is very SQL-heavy. In fact, they mention that one of the main reasons they implemented this data pipeline is that there were so many different people on their team running ad-hoc SQL queries on their production database to do analysis that it was bogging them down. Because of their strong skillset, a lot of there analysis is done with direct SQL queries into Redshift.
For the repeatable analysis that SeatGeek does, they have implemented Looker. Looker is more repeatable for them than running ad-hoc SQL queries, and has the nice benefit of showing their data in really nice visualizations.
Netflix
Last but not least, we have Netflix. Netflix has a reputation of being on the forefront of everything cloud computing, so it’s exciting to see that much of their data pipeline is technology that we’ve already discussed. I take this to mean that the data world has matured to a nice place where things make sense, and innovation can happen iteratively instead of starting new things from scratch.
Ingestion & Transformation

As a real quick note, Ursula is an internal tool that Netflix has built, but it is unfortunately not open source. We don’t know much about it, except that it takes log data from all of Netflix’s disparate sources, processes them, and dumps them somewhere - presumably in S3.
Netflix uses EMR very heavily, and they have chosen to store all of their data in S3 instead of HDFS. They have a handful of EMR clusters that work on the data in S3, one of which does nightly ETL work to format the data in a way that analysts can work with.
A Thing To Learn: Aegisthus
Aegisthus is a tool developed by Netflix to pull data out of Cassandra without creating significant load on the production uses. The idea behind Aegisthus is that Netflix needed to get data from Cassandra into their data warehouse, but it would have been disastrous to do nightly pulls of their entire cluster. The solution that Aegisthus provides is to watch for the underlying data files, called sstables, to be created, and then read those directly. Reading the sstables directly means they can get all new data out of Cassandra without actually interrupting their cluster to do the reads.
Storage, Analysis, & Visualization
Netflix’s analysis pipeline is fairly low-level compared to our other examples. I expect that, given the size of their engineering team, they have a lot of in-house visualization tools that did not make it in to their explanation of the data pipeline. Those visualizations/analyses are all probably powered by the stack we are seeing here.
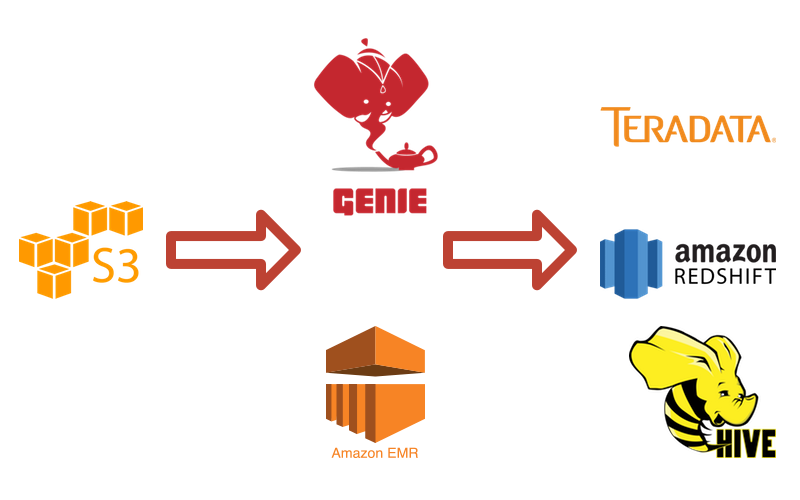
A Thing To Learn: Genie
Genie is at the very core of Netflix’s analysis methodology. Netflix takes a hybrid approach towards serving their analytics, in that they have some data that is aggregated and transformed by Hadoop, and then sent into Teradata or Redshift, and another set of data that stays in S3 to be processed by Hadoop for direct analysis.
Genie is Netflix’s tool for hosting Hadoop as a Service - it opens up an API for people to submit Hadoop, Hive, or Pig jobs to be run on a Hadoop cluster. It manages the cluster (or clusters) that will be needed to serve those jobs behind the scenes.
A Thing To Learn: Teradata
Teradata serves a very similar function to Redshift in most data pipelines. The core differences are that Teradata is a true relational database instead of a columnar store like Redshift, and it is also hosted on-premise.
Wrapup
Whew! That was a lot! I’m a bit exhausted, but I definitely feel like I’ve got a better handle on the big tools I need to know about working with data. Hopefully this all made sense, and double hopefully I understood and explained everything correctly! Let me know if I didn’t!